

Measuring Censorship: Leveraging Analytics to Gauge Effects of Twitter's "De-Boosting" (aka "Shadow-banning") Algorithms
Measuring Censorship: Leveraging Analytics to Gauge Effects of Twitter's "De-Boosting" (aka "Shadow-banning") Algorithms
If we don't work at Twitter, the De-Boosting algorithms are a black box, but maybe we can use available analytics to quantify how significantly de-boosting algorithms are limiting our reach

Lack of Transparency at Twitter
First off: If you work at Twitter, please consider leaking some information about how de-boosting is accomplished at Twitter, how accounts and tweets are targeted for de-boosting, ways of detecting de-boosting, and what techniques may help us defeat or reduce de-boosting (aside from tweeting only about non-controversial topics).
Although Twitter is a private corporation, it is also a de facto public square in the sense that there is no other place people can go and expect to have the same access and visibility with politicians, authors, journalists, activists, artists, actors, directors — in other words, movers and shakers who influence public opinion and create possibility for political change. Twitter is a forum without equal when it comes to participating in our public life, be it a democracy or other form of government (Twitter is multi-national after all).
Given Twitter’s unique importance, any manipulations of speech or reach on Twitter are manipulations of citizens’ free speech rights and there is a legitimate public interest in at least overseeing, if not regulating, the scope and scale of such manipulations. After all, if Twitter consistently de-boosted politicians of one party and boosted another party, it could certainly control the outcomes of most close electoral races. No company should be able to do that, regardless of proprietary rights.
All of that said, we know that Twitter has used and continues to use de-boosting algorithms because they’ve said that, in some instances, their de-boosting has been “impartial” (Jack Dorsey to Senate Hearing) and because there are some tools that test for some of the more obvious forms of shadowbanning1
But who, exactly, is being de-boosted or shadow-banned? It’s become something of a trope on Twitter to portray those who complain about shadow-banning as clueless bores who just don’t understand that, in reality, they’re not shadow-banned— it’s just that nobody really wants to read their tweets.
How can we tell if we’re oppressed or just boring?
One possibility is to test a couple of assumptions we might reasonably make if we posit that Twitter is a level playing field for all accounts of all demographics and ideological persuasions. We know it isn’t, but if it were, we might expect that:
Over time, our tweets would be seen by about the same proportion of our followers.
Different accounts would tend to have their tweets seen by roughly the same proportions of their followers with variations tied tightly to popularity of tweets (engagement rates).
We can test these ideas. If we know:
How many followers we have (F)
How many Tweets we made in a month (T)
How many Impressions we had in a month (I)
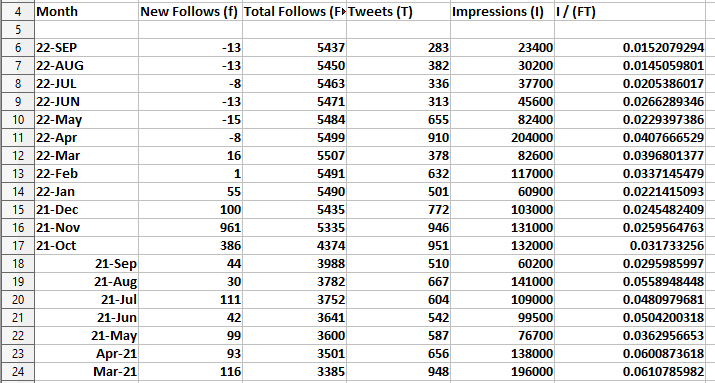
We can calculate the average percentage of our followers who will see any given tweet and compare it to a theoretical maximum as:
Impressions / ( Followers X Tweets ) or I/FT
It is imprecise, of course, because tweets might be seen by non-followers as well as followers when you reply to someone else’s tweet or your tweet is re-tweeted by someone with some number of followers who don’t already follow you. But the assumption that exposure (impressions) should be roughly proportional to the number of followers one has seems a relatively solid starting point.
When I first analyzed my own I/FT numbers, I found there was a significant drop in reach to followers between 2019 and 2021:


Because Twitter is in the business to engaging eyeballs, tweets that elicit more viewer engagement (likes, re-tweets, replies) are usually boosted to drive more user engagement not just with the author, but with the Twitter site as a whole to drive more advertising exposure and revenue.
In a level playing field all accounts’ tweets would be exposed to other users to the degree that they elicit user engagement. Thus, if your tweets typically get 10% user engagement, you might expect to get a lot more impressions for that tweet than if you were only getting a 1% engagement rate. Or, in more practical terms, any given user’s tweets should be pushed into their followers timelines up until a point where engagement rates drop below a certain global threshold, say 2% engagement. That, at least, is what we might expect if Twitter were content-blind and motivated solely by the desire to maximize user engagement and ad revenue, which, by the way, is exactly what fiduciary responsibility to shareholders would require (ahem!).
In theory, if one were being de-boosted and all else remained equal, we might expect to see a relatively high user engagement rate with a very low level of impressions — only the most strongly connected followers would be shown the tweet in their timelines and they, on average, would be more likely to like, reply or retweet. I don’t know how my numbers for these metrics compare with others’ experience yet, but I do know that my average engagement rate used to be much lower (0.5% to 1.5%) whereas now I’m seeing 4%-15% on many tweets.
One theory/metaphor I would propose is that if our tweet-content is likened to an air-like gas and de-boosting is a kind of compression or pressure, then the engagement rate is the temperature of the gas— hot content, if you will. Just as limiting a cylinder of air to a smaller space under higher pressure drives up the temperature, so too does limiting your tweets to a smaller audience drive up the strength of followers’ response to your content. In theory.
To get results for multiple users, we need multiple users (you) to analyze your stats similarly and make comparisons.
An interesting alternative would be to construct an independent app that twitter users could grant permissions to in order to re-analyze their analytics. The app could, potentially, build up a database of users and their I/FT and engagement rate numbers for more comprehensive analysis.
Overall, my level of exposure (impressions) to followers continues to decline:

And decline…
and decline… (down to 1.5%)
while the engagement rate seems to be rising— fewer people are seeing my tweets, but they tend to be more likely to engage with the content. It is difficult to form any conclusions from this. Indeed, it could be that Twitter has restricted my impressions to a smaller number of more strongly connected viewers, OR it could be that Twitter has been successfully improving their algorithms to match viewers with content they’re likely to engage with. We’d need to analyze results for more users over time to say much more about this.

In summary, my tweets are getting less and less likely to be seen by followers over time while, at the same time, the remaining audience is more receptive and interested in the content. In a level playing field scenario, a more responsive audience would translate into growing the audience, but that’s not what the data shows that Twitter is doing.
So, with that, I put my I/FT and other numbers out here for discussion’s sake. I think finding better ways to gain transparency into Twitter’s algorithms is crucial and, in the meantime, perhaps we can tease some general indicators out of the available analytics.
What do you think about Twitter’s apparent practices around boosting and de-boosting content?
If someone created an app that you could login to with your Twitter credentials and it would analyze your Twitter I/FT and engagement rate data, would you be curious enough to use it?
Without an app, you can gather the data from a combination of your home page (to get your current number of followers) and your Analytics Home page

If you scroll down, you can get numbers of Tweets and Impressions for each completed month, as well as the change in number of followers. Unfortunately, one has to calculate the number of followers for each month by using these monthly “delta” numbers to work backwards from the current number of followers.
If you create a spreadsheet for your account, please post a screen capture in the replies so we can all learn from each others’ experiences.